

Why is it so difficult to say exactly how much giving there actually is?
27th January 2022
How much giving is there?
This seems like a relatively straightforward question, but it is actually remarkably difficult to answer. In fact, when it comes to quantifying levels of giving, it is safe to say that there are significantly more unknowns than knowns. This never fails to surprise (and usually disappoint) people coming new to the world of philanthropy. I myself have lost count of the times throughout my career I have been contacted by journalists, civil servants and the like who want to get hold of what, to them, seem like fairly obvious facts or statistics; only for me to me to have to gently deflate their expectations and tell them that in fact “no one has a good figure for that”.
Now, if this was merely a bugbear for philanthro-nerds like me, or an occasional annoyance for more normal people seeking facts about philanthropy, it wouldn’t be that big a deal. But in actual fact it really does matter. It matters because what we measure often doesn’t just reflect reality; it defines and shapes it. So our inability to measure giving properly limits our ability to understand it; and even constrains our ability to give.
Why count giving?
To understand why this all matters, the first thing we should ask ourselves is why we might want to determine levels of giving. It will be helpful in exploring this question to look at some historical examples of how figures on generosity have been used. (And yes, I’m aware that I always argue it’s important to apply historical context to philanthropy, but I’m also not going to apologise for it in the slightest…)
The obvious reason for wanting a headline figure for philanthropy is to convince people that it actually matters. If we can’t quantify the contribution giving is making to our lives and our society, the chances are that it will come to be seen as largely irrelevant since the dictates of policymaking often lead to a fairly reductive view that “only what is measured matters”. Which in my opinion is a big mistake, given that philanthropy not only plays a vital role in funding the existence of a healthy civil society but also acts as a major mechanism for the allocation and redistribution of resources (alongside the state and the market). Whether or not you think that it is a good thing that philanthropy plays this role, if the data shows that levels of giving are significant in the context of overall levels of expenditure by the public and private sector, then at least it is clear that it is something which deserves our proper attention.
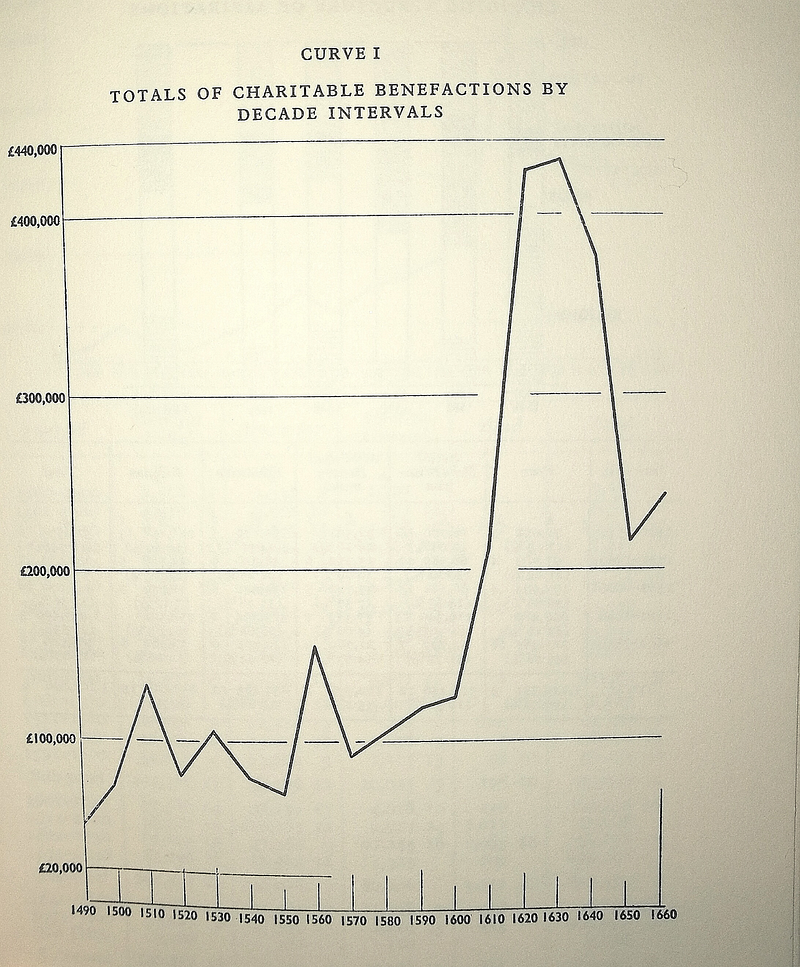
Another reason for wanting good figures on how much giving there is, is that without it is hard to know what impact (if any) external factors have on levels of generosity. In some cases this might be of interest primarily from a historical perspective. The historian W.K Jordan, for instance, whose 1959 book Philanthropy in England 1480–1660 remains a key text in the history of philanthropy, based his central argument on analysis of data about charitable bequests made during the period in question, which allowed him to argue that the Reformation and the subsequent rise of Protestantism led to the birth of a new form of philanthropy and an accompanying surge in giving. (And before any historians of philanthropy splutter into their coffee too badly, don’t worry- I will come to the problems with Jordan’s analysis a bit later on…)
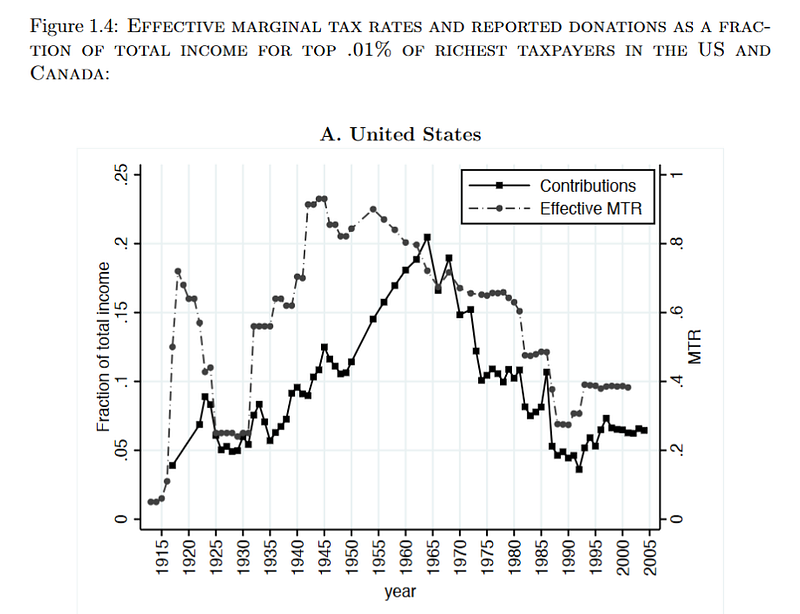
Data on levels of giving can also be of use in ways that more clearly relate to current practice and policy. In a 2012 conference paper, for instance, Gabrielle Fack and Camille Landais used long run data from Canada and the US on reported donations by the very wealthy and tax rates to assess what, if any, relationship there is between the two. Others have made similar attempts to use historical data to explore the link between tax and generosity, and this remains a crucial question because the exact relationship between tax rates and levels of philanthropic giving is still contested. This makes it difficult to have proper evidence-based discussions about the purpose of tax incentives for giving and how they should best be structured, and also stymies efforts to propose fiscal measures that could encourage more giving (where that is the aim).
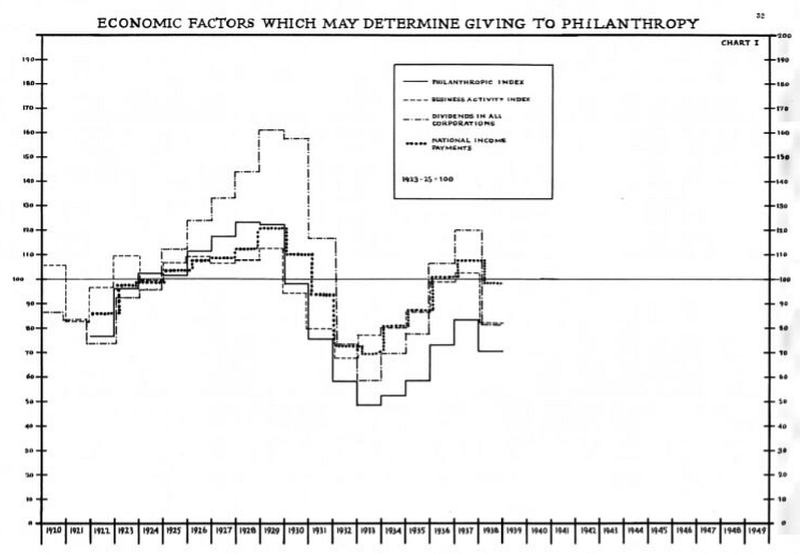
Having reliable long-run giving data can inform our understanding not only of factors like taxation, which we can influence directly through policy decisions, but also of other macro-economic or political factors that we might not be able to control. This is valuable, because even if we cannot necessarily control these factors, if we understand their relevance to levels of giving we can at least take them into account in terms of how organisations fundraise, or how we design any future policy efforts to boost levels of giving. As far back as 1940, for instance, the Yearbook of Philanthropy in the US, published a series of graphs of “economic factors which may determine giving to philanthropy”. More recently, in 2009 John Mohan and Karl Wilding published a fascinating article looking at what long-term historical data on giving from both the UK and US can tell us about the impact of economic downturns on levels of generosity (“Economic downturns and the voluntary sector: what can we learn from historical evidence?”), which found that whilst these events do seem to have a negative impact on charitable giving, it is less pronounced than one might suppose.
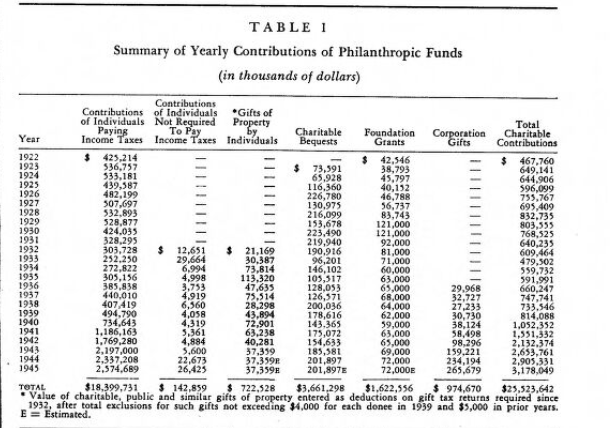
Giving data that ranges over time or place can also provide valuable context. If we are able to look back at levels of giving in the past, we can get a better sense of how current levels compare and this can help to shape our narratives and policy responses. If, for instance, current levels of giving are significantly higher than they were historically, we can focus efforts on trying to understand what is driving the growth; if, on the other hand, current levels are lower than might be expected, we might want to focus more on proactive efforts to boost giving. The same goes for geographic spread of data: being able to compare across different regions or countries gives us some context for assessing whether our own country or region is “doing well” when it comes to giving. The 1947–48 edition of the Yearbook of Philanthropy, for instance, contains a table charting the growth of overall levels of charitable contributions in the US between 1922 and 1945, including a breakdown by different types of giving:
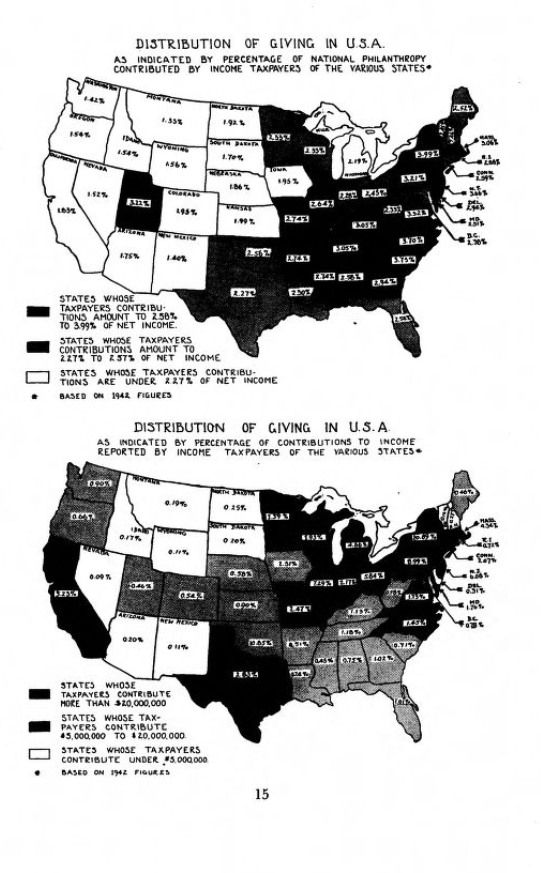
The 1945–46 edition of the Yearbook of Philanthropy also contained a map showing the relative generosity of US states calculated by their percentage contribution to the overall amount of philanthropy in the country.
An 1885 article in The Times reporting on recently-released figures for the income of charities in London, meanwhile, managed to use geographic and historical data (albeit with a hefty dose of anecdote) to achieve a characteristic balance of patriotic pride and nostalgia-infused disdain for the present: arguing that whilst generosity in the capital outstripped the revenues of various European states, things were still better in the past:
“Measured by money the London charities are the equals of several independent Governments, Their revenues are more than twice that of the Swiss Confederation. They slightly exceed that of Sweden, and greatly that of Denmark. Portugal, after providing for the charges of its debt, is much poorer, and the Netherlands and Belgium not much richer. They could defray the public expenditure of Persia and leave the Shah with two to three million sterling to lay out on diamonds. An income of £4,447,496 for the charities of London alone seems magnificent. In reality it is less than the average. Recent times have pressed heavily on the regular contributors to benevolent purposes, and economy in subscriptions is as easy as in men servants and carriages.”
The appeal of comparison across countries and along time periods is also why CAF’s World Giving Index, which has compared levels of generosity around the world for more than a decade, has proven so effective in garnering interest each year. Whilst the measures used to compile the report are themselves admittedly relatively simplistic (and I say that as someone who worked at CAF for a long time and was party to many discussions about the World Giving Index, where this was always acknowledged), it does allow countries to compare themselves against other countries, and also to track their own performance over time to see if their culture of giving is getting better or worse.
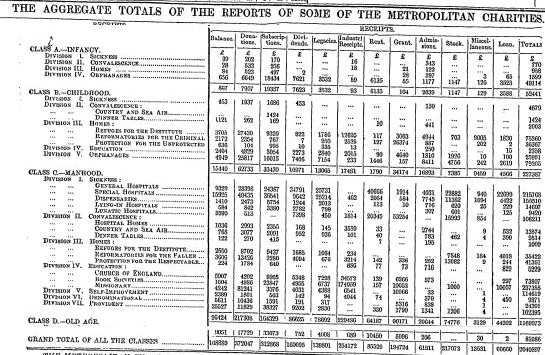
Comparing headline figures for giving clearly has its uses, but what is generally of more use to practitioners is finer-grained data that allows us to understand how much giving is going to different cause areas, localities, organisational types etc. That way we can identify imbalances between supply and demand, “hot” and “cold” spots in voluntary provision, and areas where there is a risk of duplication. This can then provide an evidence base to inform philanthropists and charities, in the hope of making the overall philanthropic ecosystem more rational and effective without the need to impose additional external regulation or legislation. Or at least, that’s the theory. And it is a theory that has appealed to many over the years: in 1850, for instance, Sampson Low published the first edition of his Charities of London (subsequently updated and republished many times), which sought to provide as complete a picture as possible of the work of charities in the capital and their finances. In 1886 The Times similarly gave over several whole pages to a report by G M Hicks on London charities, including detailed breakdowns of their income and expenditure:
The rise of the Charity Organisation Society (COS) movement in the late C19th and early C20th gave further impetus to this kind of data collection, as a key part of their mission to do away with the perceive scourge of “indiscriminate” giving was providing potential donors with information on how their money might be best directed. As such, many local Charity Organisation Societies in the UK and the US, and the main Charity Organisation Society (based in London), produced reports detailing the operations of charities in their area and often included estimates of their income from donations and subscriptions (gifts that conferred membership rights, which were the dominant model for much of the 19th century).
The COS movement was loved by some, but reviled by many others for its moralistic view of poverty (based on a sharp distinction between the “deserving” and “undeserving” poor). It eventually petered out in the early 20th century, but in the UK it had a significant impact on the founding of the network of local Councils for Voluntary Service (CVSs) and the establishment of the National Council for Social Service (NCSS) in 1919, which eventually became the National Council for Voluntary Organisation (NCVO): the body that still acts as a key data source on the charitable sector via its annual Almanac publication. Much more recently organisations such as 360 Giving have echoed some of the COS’s original aims through their efforts to collect and share data on the voluntary sector- at least in part with the purpose of making flows of philanthropic capital better-directed and more effective (although very much minus the moralising views on poverty, I hasten to add!)
What are we counting & how do we count it?
Once we know why we want to gather data on levels of giving, the questions then are what exactly are we going to count and how are we going to count it? These are fairly inextricably linked as the choice of what to count (and it is a choice, as there is no fixed definition of “philanthropy” or “giving” so we are always making value judgments about what to include and what to leave out) clearly determines the range of options available in terms of how we go about counting. But conversely (and more problematically), the limitations of our ability to count often dictate what gets included in the overall definition of giving (or at least the version that makes it into official figures), so how we count ends up determining what we count.
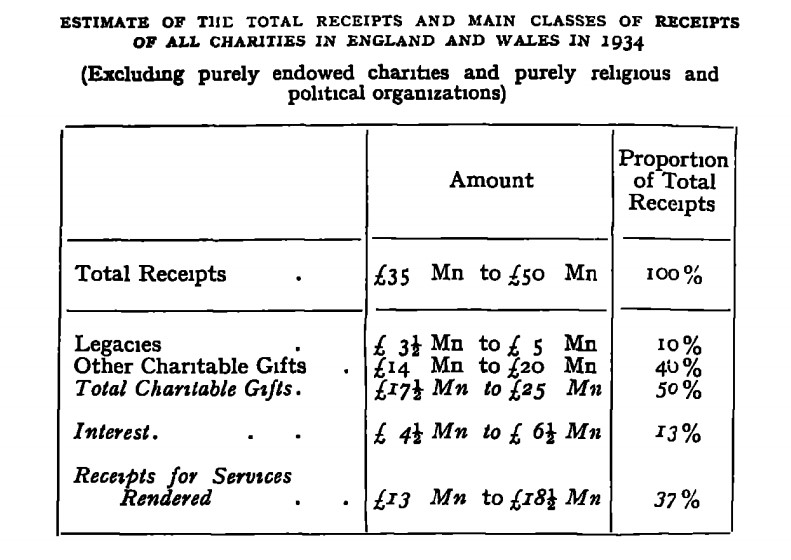
Methodological challenges have been a major feature of the history of efforts to quantify giving. The publications by Sampson Low or the Charity Organisation Society mentioned above, for example, are fairly easy to pick holes in since the samples they draw from are far from representative (and in Low’s case, his work was at the time met with criticism that some of the things he chose to include are idiosyncratic at best). In her 1939 book The Voluntary Citizen, meanwhile, social scientist Constance Braithwaite valiantly tried to pull together some of these existing estimates to find an overall figure for giving in the UK. She arrived at a figure “somewhere between £35m and £50m” (which is obviously a pretty big margin of error!), but admitted herself that:
“Any account of the statistics of charitable finance is of necessity very incomplete because of the scarcity of collected information”.
It is important to note that a big part of the problem in the UK was that for a very long time no-one was keeping any sort of central register of charities. The Charity Commission for England & Wales has existed in something like its modern form since 1853, but for most of that time its purview was limited to charities that had endowments; it didn’t take on responsibility for non-endowed voluntary associations until 1960, so up to that point there was almost no compunction on those organisations to collect or share data on their finances. Given that these non-endowed organisations made up the vast majority of the voluntary sector from at least the late 18th century (and accord most closely what we would these days normally think of as “charities”), this presents a significant barrier to coming up with historical figures for giving that feel anywhere near accurate.
WK Jordan found a similar problem with his aforementioned Philanthropy in England 1480–1660. His efforts to use giving data to back up his argument about the growth of post-Reformation philanthropy were heavily criticised by subsequent historians (e.g. in this paper by Bittle and Lane). The criticism was in part that Jordan had failed to take into account inflation in his figures, but more substantively it was that he had painted a distorted picture by extrapolating from data that included only charitable bequests to unwarranted conclusions about philanthropy as a whole As Ilana Krausman Ben Amos argues in her book The Culture of Giving: Informal Support and Gift-Exchange in Early Modern England: “A broader assessment of all forms of private gifts that were given at the time of death or during the individual’s lifetime — perpetually endowed gifts, but also non-recurring gifts and one-time contributions — indicates that a wide amalgam of gifts and donations, among which the lavishly endowed testamentary bequest was one, persisted and became more vigorous as the period progressed”. (Though it should also be noted that whilst Ben Amos, like many others, is critical of Jordan’s methodology, she acknowledges that his broad assessment that there was a growth in charitable giving following the Reformation “remains sound”).
The accuracy or otherwise of giving data for the 15th and 16th centuries is obviously only of real interest to historians (or weirdos like me), but this example also highlights a much wider point about the ways in which the data available to us shapes our narratives about philanthropy, and the dangers of extrapolating from narrow data to broad conclusions about giving as a whole. This is something we still need to be keenly aware of. As Lucy Bernholz argues in her recent book How We Give Now: A Philanthropic Guide for the Rest of Us, the “ giving space” is currently expanding in many different ways to encompass new forms of formal and informal donations of money, time and other resources: yet the ways in which we have chosen to categorise and segment the nonprofit sphere and what is to count as “giving” have not kept pace with these changes. Hence we may be failing to understand the ways in which giving behaviour is evolving or, even worse, stifling that evolution through our adherence to rigid definitions and measures that no longer reflect the realities of how people choose to do good in the world. (You can also hear me discuss this further with Lucy on an episode of the Philanthropisms podcast).
Why are we so bad at measuring giving?
Why is it, then, that our current methods of measurement continue to fall short of capturing the full picture of giving? Well, in part, it is once again a question of the choices we have made and continue to make about what to include and what to leave out. In the UK, for instance, registered charities are not allowed to have overtly political purposes (a rule that is, by the way, largely down to a quirk of history rather than any carefully-decided point of principle- as explained in this Twitter thread). This means that many social change organisations and campaign groups do not have charitable status, so tend not to be captured in figures for giving (unless a deliberate effort is made to include them). Given that one of the main themes in civil society in recent years has been the rise of new digitally networked protest movements like Black Lives Matter and Extinction Rebellion, if we are failing to count support for such movements this would seem like a significant failing.
Similarly, direct peer-to-peer gifts between individuals via crowdfunding platforms like GoFundMe or payment apps like CashApp or Venmo have grown enormously in recent years; yet these also may not be captured by our current methods of counting giving. It might be argued that in some cases these examples stretch the boundaries of what we would traditionally define as philanthropic giving. However even if that is the case, if the people giving the gifts view them as philanthropy, then rather than “correcting” those perceptions because they do not fit in neatly with the structures and definitions used in the professionalized nonprofit world, perhaps instead we should look to expand our horizons and recalibrate our definitions of “philanthropy” and “giving” to encompass a much wider range of activities?
It is not entirely a question of choices, however. There are also practical challenges that determine how we are able to measure giving, and thus shape our understanding of what giving is. To understand what these challenges are, it helps to think about what an act of giving looks like and where the various points are that one might capture data. (Let’s assume for the sake of argument that we are talking here about giving in the sense of a transfer of financial assets of some kind; whilst acknowledging that donations of time, skills, data and other resources are equally important).
One possibility (and the best one in many ways) would be to capture the gift at the point of donation. However, this requires firstly that the transaction is made in such a way that it is recorded, and secondly that we have clear criteria from the outset about which transactions are to count as “gifts” and which are not. The latter brings us up against the challenges of defining giving that we have already discussed; the former, meanwhile, raises a separate practical challenge in that there is a high likelihood that many transactions we would want to take into account are made in ways that do not easily lend themselves to being captured. This is certainly true for physical cash donations, which still make up a hugely important part of the landscape of giving. Where there is technological intermediation of some kind — such as online donations from a bank account or donations via a payment app — there may be more potential to capture donations, because each transaction will leaves a digital footprint that could (in theory) be used to identify it and classify it as part of the overall total of giving. However, we are a long way off that working in practice, and there are significant barriers to overcome in terms of the incentives for intermediaries to capture giving data or to make it available to others (as nebulous concerns about “commercial advantage” often get in the way).
Another possibility is to capture data at “the other end”, by looking at information from recipients on the income from donations. The advantage of this is that you know for a fact that the gift has definitely been made, but there are a number of clear disadvantages too. Not least of these is the fact that you clearly have to decide which potential recipients you are going to take into account, so once again you are making a choice that constrains what is to count as legitimate giving. And the choice in this case is likely to be even more limiting, as the options will presumably be restricted to formal organisations that report their finances. Informal groups and individuals don’t provide that sort of information, and thus will almost certainly not get counted if this kind of approach is taken. Another disadvantage is the practical one that waiting for data on gifts to be reflected in the financial reports of recipient organisations introduces a time-lag, so that data on giving can only be compiled significantly after the event. This may be fine if the purpose of the data is to inform long-term policymaking, but it makes it far less useful for informing immediate practice.
The third and final option is to ask people what they have given. This might be through the tax system, by requiring people to report on their donations in order to get tax relief. This happens to some extent in the UK, as Higher Rate taxpayers can claim back the higher rate tax they have paid on donations in the form of personal relief via self-assessment. However, the basic rate tax paid on donations by any eligible donor is reclaimed by recipient charities via the main Gift Aid system, and the number of donors who make additional use of the higher-rate reclaim function remains relatively small (a problem exacerbated by the fact that many people pay tax direct from their salaries via the PAYE system, so unless they have an existing reason to fill in a separate self-assessment they are unlikely to do so simply to claim back for their charitable donations).
In the US, the charitable deduction takes the form of a direct personal relief, so it makes far more sense to look at the figures from tax returns as a way of measuring levels of giving (and that has long been a core part of how giving is measured in the States). However, even in the US context we need to be very wary of taking any figure arrived at from the deductions reported on individual tax returns as a basis for extrapolating overall figures for giving. Firstly because we are, by definition, only considering tax-advantaged giving here, and there is plenty of giving where tax reliefs are either not claimed or can’t be claimed because the gifts are going to recipients that do not meet the tax authority’s eligibility criteria. And secondly because the specific charitable deduction in the US is only available to “itemizing” taxpayers (i.e. those who list out their deductions separately), and many people choose instead simply to take the “standard deduction”- where a whole bunch of available reliefs (including those for charitable giving) are bundled up together into one composite relief. Itemizing mostly makes sense if you are separately claiming for things like mortgage interest allowance so it has long been closely correlated with higher incomes; there has therefore always been an inherent bias in the US charitable deduction system towards rewarding the wealthy more for their giving. This situation has been exacerbated by the passage of the Tax Cuts and Jobs Act in 2017, which increased the value of the standard deduction and thus raised the level of income at which it makes sense to even bother claiming the standalone charitable deduction. As a result, as noted by Lucy Bernholz, by mid 2019 the percentage of taxpayers taking the charitable deduction fell from 25% to 8.5%. It is clear, therefore, that any figures on donations obtained from tax returns, whilst potentially interesting in themselves, tell us little at this point about the overall picture of giving in the USA.
The other option when it comes to asking people about their donations is to do so entirely separately using polling methods, and this is how a lot of research on giving is in fact done. There are, of course, always all sorts of challenges when it comes to using polling to measure giving. How, for example, do you ensure that your sample is representative and sufficiently well-constructed that any findings are statistically significant? Is there a danger when asking people about their past giving that they will display “recency bias” and give more weight to things that happened more recently? More generally, can we reasonably expect people to have an accurate recollection of how much they have given? Do we also need to be aware of the potential gap between stated and actual behaviour, particularly given the temptation to overstate one’s generosity in order to appear more virtuous to the interviewer? (So many rhetorical questions…)
Polling also doesn’t necessarily escape the issue that we have already discussed about how defining giving necessarily involves including some things and excluding others. Yes, of course in theory one might be able to ask an open-ended question that leaves it up to a poll respondent to decide for themselves what they count as philanthropic or charitable giving, but in reality polling tends to involve using prompts to clarify for people what is being asked (in this case most likely a list of the “sorts of activities that count as philanthropic giving”). Clearly the choice of what is on this list once again constrains the limits of what we count as giving (albeit less directly, as people responding to a poll might well decide for themselves to define things however they please!) So polling is not an ideal solution by any means, but given the limitations of the other options it is likely to remain an important tool for the foreseeable future. (To paraphrase Winston Churchill’s remark about democracy: “Polling is the worst form of measuring giving- except for all the others that have been tried…”)
So what now?
It should be apparent from what has been said that measuring philanthropic giving has always presented a challenge, and continues to do so. This is clearly something that we should want to address, as only by measuring giving more effectively can we understand properly how it works and the role it plays, and thus make a compelling case for its full value and importance. However, we must also be aware that an increased focus on measurement may bring new challenges, as the decisions we make about what to measure and how to measure it have consequences. If the categories and measures we use increasingly fail to reflect the reality of civil society because people are using new approaches and new technologies to do good in a wide variety of different ways, then we need to reassess those categories and measures or risk falling out of step with the directions in which giving is evolving. Likewise, if we decide to prioritise certain types of giving (e.g. financial donations to formal nonprofits) over all others simply because those reflect the dominant status quo, the danger is that we miss out on a vast amount of other activity going on at the same time and thus get a flawed picture of the current state of giving. Moreover, since many marginalised communities have historically relied more heavily on informal modes of giving and traditions of mutual aid, the likelihood is that we would end up disadvantaging these communities further if the ways in which we choose to measure generosity are tied rigidly to existing formal systems and structures.
In my opinion it is far from true that “only what is measured matters”, so we need be willing to embrace the idea that there are aspects of the value of giving and the work of civil society that may never lend themselves to data points or figures on a spreadsheet. However, it does matter what we measure and how we measure it, because any such measurement plays an unavoidable role in shaping our view of the nature of civil society and our perception of what is of value. Getting this balance right by ensuring that we broaden our definitions of what should count as “giving” and measuring effectively (but without deifying measurement above all else) is, for my money, one of the key challenges for civil society in coming years.